Get historical measurements per channel in Grafana

Do you want to visualise a channel of your multi-parameter sensor? Then this step-by-step guide is for you.
Have you already read and completed the steps of part one of this guide? Make sure these have been carried out correctly before continuing.
Step 1: Get the right API call
If you want to get measurement data from one channel, you'll need to use the correct type of API call:
https://api.crodeon.com/api/v2/reporters/{master_id}/sensors/{device_id}/channels/{channel_index}/measurements
For this API you need the following information from your Reporter:
- master_id = Reporter device ID
- device_id = Sensor device ID
- channel_index = Channel index (parameter of the selected sensor)
In this guide we will need the Reporter device ID of which you want to visualise the data. You can find this information on the 'Configure Reporter' page on the Crodeon Dashboard. For this example, we'll be using our demo weather station in Roermond (NL):

Step 2: Create new Grafana Dashboard
We have chosen our type of API call, now we can start building our Grafana dashboard using our Reporter data! Therefore we will create a new dashboard to start:

In this guide we will refer to the Settings of a dashboard. The settings can be entered/exited through following button:

When in the settings, you can navigate Back to dashboard with a button on the same location.
Furthermore, we will create some variables in the following steps. If you need more information on variables and Grafana, you can consult following documentation on grafana.com.
Step 3: Create API linked variables
To be able to user our API call, we need some variables which we will create variables for our Grafana dashboard for.
| API variable | Grafana dashboard variable |
|---|---|
| master_id | ReporterDeviceID |
| device_id | SensorDeviceID |
| channel_index | ChannelIndex |
Steps to add the variable
1. Navigate to the Settings of the dashboard.
2. Go to the Variables tab.
3. Now click Add Variable
4. The first variable will be the Reporter device ID.
- Variable type is a Constant
- use ReporterDeviceID for the Name
- Fill in the Value with your Reporter device ID acquired from the configure page
- Navigate Back to list of variables

5. Click on New variable to add a second variable for the Sensor device ID
- We will use a Queryvariable type to get dynamic sensor info from our API
- use SensorDeviceID for the Name
- set Label to Sensor DeviceID
- Fill in the Query options
- Select your data source, for this purpose we created 'Crodeon-API-Demo-Infinity-datasource' in our previous blog
- set the Query Type to Infinity
- Change the Parser to UQL
- Update the URL to
https://api.crodeon.com/api/v2/reporters/${ReporterDeviceID}/sensorsNotice we are using the previously created variable in the url. - Expand the UQL settings and copy paste the following UQL query:
parse-json

| scope "sensors"

| project "__value"="device_id.id", "__text"=strcat('[',"device_id.id",'] ',"label")
- Verify if the Preview of values shows your sensors
6. Click on New variable to add a third variable for the Channel index
- We will use a Query as variable type to get dynamic channel info from our API
- use ChannelIndex for the Name
- set Label to Channel
- Fill in the Query options
- Select your data source, for this purpose we created 'Crodeon-API-Demo-Infinity-datasource' in our previous blog
- set the Query Type to Infinity
- Change the Parser to UQL
- Update the URL to
https://api.crodeon.com/api/v2/reporters/${ReporterDeviceID}/sensors/${SensorDeviceID}Notice we are using both previously created variables in the url. - Expand the UQL settings and copy paste the following UQL query:
parse-json

| scope "channels"

| project "__value"="index", "__text"="label"
6. Verify if the Preview of values shows your sensor channels
5. Navigate Back to list of variables
Step 4: Create variables for graph visualisation
To be able to have better graph visualisation, we will add three more variables which can be used in the graphs. These variables will use the API to get details for the channel selected.
The following variables should be added:
| Grafana dashboard variable | UQL query |
|---|---|
| ChannelLabel | parse-json |
| ChannelValueMultiplier | parse-json |
| DisplayUnit | parse-json |
Repeat the following steps for all the variables in the table above
- Navigate to the Settings of the dashboard.
- Go to the Variables tab.
- Now click Add Variable (Note: you can also duplicate a variable and edit it)
- We will use a Query as variable type to get dynamic channel info from our API
- use the variable name in the table for the Name (eg: ChannelLabel)
- Change Shown on dashboard to Nothing
- Fill in the Query options
- Select your data source, for this purpose we created 'Crodeon-API-Demo-Infinity-datasource' in our previous blog
- set the Query Type to Infinity
- Change the Parser to UQL
- Update the URL to
https://api.crodeon.com/api/v2/reporters/${ReporterDeviceID}/sensors/${SensorDeviceID} - Expand the UQL settings and set the script to the script from the table
- Verify if the Preview of values shows something meaningful
Step 5: Add a graph visualisation
Now all the information is available in the dashboard via the variables, we can start using them to create a graph
- Exit the Settings and go Back to dashboard
- Select Add visualisation
- Select your data source, for this purpose we created 'Crodeon-API-Demo-Infinity-datasource' in our previous blog
- Modify the Data source settings in the new panel configuration
- Change the Parser to UQL
- Modify Format to Time Series
- Update the URL to
https://api.crodeon.com/api/v2/reporters/${ReporterDeviceID}/sensors/${SensorDeviceID}/channels/${ChannelIndex}/measurements?page_size=100000&start_time=${__from:date:iso}&end_time=${__to:date:iso} - Note: we added three request parameters to have the time range picker of Grafana working. See grafana.com for more info.
- Expand the UQL settings and copy-paste the following UQL query:
parse-json

|scope "items"

|project "timestamp"=todatetime("timestamp"), "value"=mul("value",$ChannelValueMultiplier)
Step 6: Update graph labels
At this point, the data is now visible within the graph, but the legend is not yet showing anything meaningful. Therefore we can use the variables created in step 4 to gloss over our graph.
At the right side of the edit panel view, you can set some info like:
- change Title to ${ChannelLabel}
- At the bottom, use Add field override
- Select Fields with name and choose the value item in the dropdown list
-
Add override property
- Property: Axis > Label
- Value: ${DisplayUnit}
-
Add override property
- Property: Standard options > Display name
- Value: ${ChannelLabel}

Step 7: Finish
Go Back to dashboard and don't forget to Save dashboard. After saving, you can Exit edit mode, and start using your new dashboard.
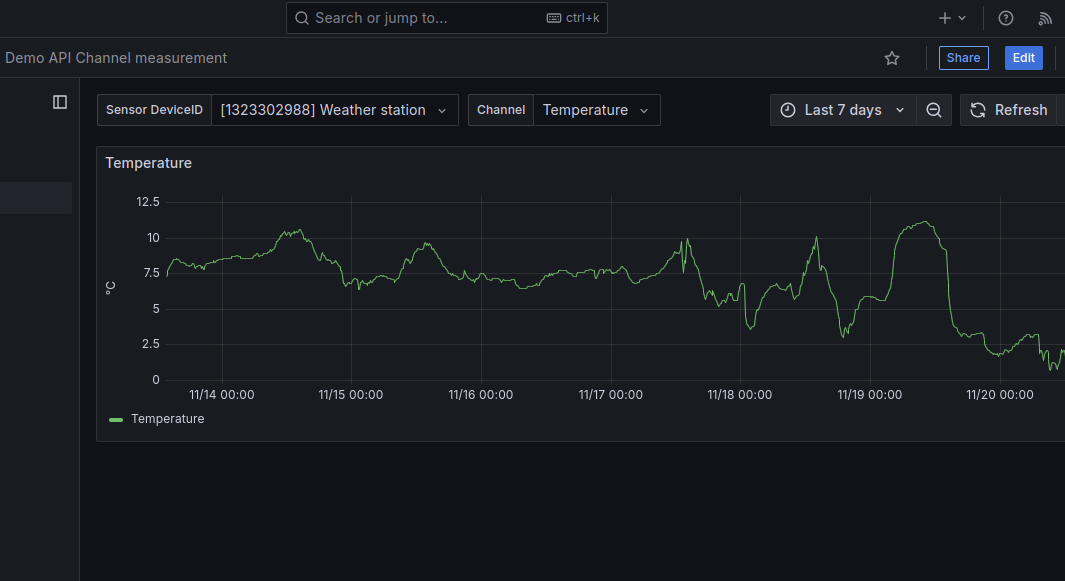
The dashboard has now 3 selectors:
- Changing the sensor connected to Reporter
- Changing the channel of the sensor
- Changing the time range you want to see the data from
There is limit of maximum 100000 data points set. The maximum data range depends on the measurement interval of your Reporter.


